As a follow-up to my earlier post describing the process to create custom Advisors for MySQL Enterprise Monitor, this post will demonstrate how to create custom graphs to track metrics over time. The password policy scripts I introduced earlier will again be the basis for the data used in this post.
Collecting new data
Similar to the custom Advisor created in the earlier post, creating a custom graph starts with custom data collection. Why can’t I just use the data collections I defined in the earlier example? Because there’s a restriction on using multiple custom data types (defined as namespace+classname combinations) in a single graph, and in the earlier example, I used a different classname for each password policy definition. I want to graph all three password policy violation counts as distinct lines on the same graph, so I need change how I collect data so that I get it all back in a single data type. Here’s what I’ve added to custom.xml:
    <class>
                <namespace>password_policy</namespace>
                <classname>graph</classname>
        <precondition><![CDATA[
  SELECT COUNT(*)
    FROM information_schema.tables
    WHERE table_schema = 'password_policy'
    AND table_name = 'user_password_policy_violation'
            ]]></precondition>
                <query><![CDATA[
  SELECT SUM(IF(violation_type = 1, 1, 0)) no_password_count,
      SUM(IF(violation_type = 2, 1, 0)) expired_password_count,
      SUM(IF(violation_type = 3, 1, 0)) reused_password_count
    FROM password_policy.user_password_policy_violation
    WHERE violation_resolved = 0
                ]]></query>
                <attributes>
                        <attribute name="no_password_count" counter="false" type="INTEGER"/>
                        <attribute name="expired_password_count" counter="false" type="INTEGER"/>
                        <attribute name="reused_password_count" counter="false" type="INTEGER"/>
                </attributes>
    </class>
As before, make sure you test your SQL! It’s a real headache to get to the end of this process only to find your graph doesn’t work, and spend time tracking down the problem as bad SQL. That’s one of my wish requests for custom rules and graph creation – making it easier to diagnose problems.
Save the custom.xml file, and restart the Agent to reload the custom data collection definitions.
Define the custom graph
This also involves XML, and you can find a sample in the MEM documentation. I’ve pretty much copied that example and tweaked it. Here’s the resulting XML:
<?xml version="1.0"?>
<com_mysql_merlin_server_graph_Design>
    <version>1.0</version>
    <uuid>a77cd4f0-d3a4-4f69-a346-6f36fb6a2f56</uuid>
    <name>Password Policy Violations</name>
    <rangeLabel>Accounts</rangeLabel>
    <series>
        <label>blank passwords</label>
        <expression>blank_count</expression>
    </series>
    <series>
        <label>expired passwords</label>
        <expression>expired_count</expression>
    </series>
    <series>
        <label>reused passwords</label>
        <expression>reused_count</expression>
    </series>
    <variables>
        <name>blank_count</name>
        <dcItem>
            <nameSpace>password_policy</nameSpace>
            <className>graph</className>
            <attribName>no_password_count</attribName>
        </dcItem>
        <instance>/</instance>
    </variables>
    <variables>
        <name>expired_count</name>
        <dcItem>
            <nameSpace>password_policy</nameSpace>
            <className>graph</className>
            <attribName>expired_password_count</attribName>
        </dcItem>
        <instance>/</instance>
    </variables>
    <variables>
        <name>reused_count</name>
        <dcItem>
            <nameSpace>password_policy</nameSpace>
            <className>graph</className>
            <attribName>reused_password_count</attribName>
        </dcItem>
        <instance>/</instance>
    </variables>
</com_mysql_merlin_server_graph_Design>
Let’s break down the components. First, you need to define a UUID. I’ve previously just incremented the UUID from the example, but you can use any UUID generator you like. I used PowerShell (thanks Josh!):
D:\>powershell -Command "[guid]::NewGuid().ToString()"
a77cd4f0-d3a4-4f69-a346-6f36fb6a2f56
The <name> tag defines how this graph will be named and displayed in the dashboard. This must be unique. The <rangeLabel> should define what is displayed as the label for the Y-axis of the graph, but that seems to be affected by a bug (Oracle Bug#17556299) with custom graphs today.
For this graph, I’ve defined three different <series> – one representing each password policy. Each series has a <label> element, which defines the label for the series, and an expression. Like custom rules, you can do some transformations and computations here – the documentation has a good example, converting raw byte counts to megabytes for graphing purposes. We’re not using that here – our expressions are simply the number of violators of a given password policy. The values used – blank_count, expired_count, reused_count – are all defined in <variables> elements below. The <name> element of the <variables> tag should correspond to the value used in the <expression> tag of <series> elements above, and the <nameSpace>, <className> and <attribName> should map to the custom data collection definition, where they are found in <namespace>, <classname> and <attribute name=”…”> tags, respectively.
Upload the graph definition
Once the graph definition is complete, save it. The name doesn’t matter, as we’re going to upload it to the MEM dashboard. Finding where to upload it can be a bit tricky, though – you’ll find it by clicking the “Advisors” option under the “Configuration” menu item. Right next to the “Create Advisor” button used to create a custom rule, you’ll find the “Import / Export” button. That’s the one you want. This will take you to a page where the important elements look like below:
![]()
Use the panel on the right to import the XML file containing the custom graph definition.
Schedule the graph
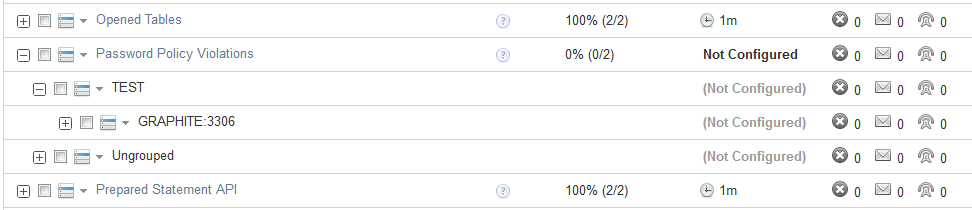
You might be tempted at this point to go directly to the graphs page and look for your graph. If you do, you won’t find it. The graph must first be scheduled. On the same “Advisors” page (under “Configuration” again), notice that the “Graphing” header shows something like, “Configured: 94 of 95”. That’s letting you know that your newly-created graph hasn’t yet been configured – expand the “Graphing” header and find the custom graph name (“Password Policy Violations”). Drill down until you find the appropriate MySQL Server instance against which to schedule the graph, click on the menu icon next to the server name, and schedule it. I chose to collect data every 1 minute; in a production environment, you may want to do this less often.
 Once the graph has been scheduled, the Service Manager will tell the Agent to start collecting the necessary data the next time it checks in. Because the graphing components need at least two data points to generate a graph, you’ll want to wait a couple of minutes before looking for results in the graphs.
Finding the custom graph
After waiting the requisite couple of minutes, navigate to the “All Timeseries Graphs” item under the “Reports & Graphs” menu item. Select the appropriate host from the asset selector on the left-hand side, and expand the filter options by clicking the magnifying glass icon towards the top-right of the page. Here, you can select the “Password Policy Violations” graph, push the “Filter” button, and be rewarded with a view of your custom graph:
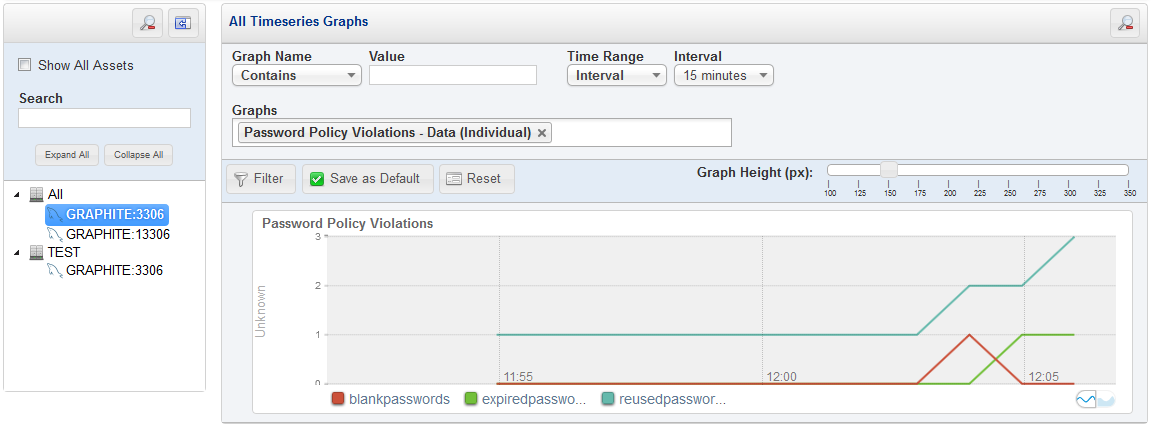 Note that I manipulated the password_policy.user_password_policy_violation table to show something more interesting than flat lines.
Conclusion
Custom graphs can give you visibility into trends over time for certain characteristics. While the example presented here uses custom data elements, you can create your own custom graphs using either standard data elements MEM already collects or extend MEM’s data collection to expose metrics useful for monitoring your applications or deployments.
