Knowing which privileges a given account has is easy – just issue SHOW GRANTS FOR user@host. But what about when you need visibility into privileges from the other direction – which accounts can access specific data? If you’re a DBA – or perform DBA duties, regardless of your title – you may have been asked this question. It’s an important question to ask in an audit or compliance review – but it can be a difficult question to answer. This post will walk through how to assess this, but if you’re impatient and need answers to this question immediately, jump to the end – there’s a simple shortcut. Continue reading Which accounts can access this data?
Tag Archives: MySQL Enterprise
Secure Java Connections by Default
MySQL Connector/Java 5.1.38 was released earlier this week, and it includes a notable improvement related to secure connections. Here’s how the change log describes it:
When connecting to a MySQL server 5.7 instance that supports TLS, Connector/J now prefers a TLS over a plain TCP connection.
This mirrors changes made in 5.7 to the behavior of MySQL command-line clients and libmysql client library. Coupled with the streamlined/automatic generation of TLS key material to ensure TLS availability in MySQL Server 5.7 deployments, this is an important step towards providing secure communication in default deployments. Continue reading Secure Java Connections by Default
SSL/TLS Improvements in MySQL 5.7.10
Secure communications is a core component of a robust security policy, and MySQL Server 5.7.10 – the first maintenance release of MySQL Server 5.7 – introduces needed improvements in this area. Support for TLS has been expanded from TLSv1.0 to include TLSv1.1 and TLSv1.2, default ciphers have been updated, and controls have been implemented allowing both server and client-side configuration of acceptable TLS protocol versions. This blog post will describe the changes, the context in which these changes were made, note important differences in capabilities between Community and Enterprise versions, and outline future plans. Continue reading SSL/TLS Improvements in MySQL 5.7.10
Identifying which connections are secure
A key theme of the MySQL Server 5.7 release is much improved security. Earlier releases of MySQL 5.7 have introduced features supporting this initiative including automatic generation and detection of TLS key material and client-side preference for TLS connections. The recent MySQL 5.7.8 release builds upon this and provides additional monitoring and audit capabilities that make it easy to answer the question, “How secure are my client connections?”
MySQL High Availability with Oracle Clusterware
MySQL has an extensive range of high-availability solutions to suit many different use cases and deployment needs. This list spans from the time-tested – yet continuously-improved – MySQL replication to the just-released MySQL Fabric, giving users many certified solutions for highly available MySQL deployments. The list is growing yet again, with Oracle Clusterware adding support for MySQL.
Oracle’s Clusterware product is the foundation for the Oracle RAC, and has been battle-tested for high availability support for Oracle database, as well as other Oracle applications. This technology is now available as part of the MySQL Enterprise subscription, and – like all Oracle commercial products – is freely available for evaluation purposes. This post will explain Oracle Clusterware architecture and the benefits to MySQL users, and will be followed by a later post focusing on how to deploy Clusterware agents with MySQL.
A very flexible architecture gives Oracle Clusterware the ability to support various consistency mechanisms. The initial release of the Clusterware agent for MySQL uses a shared resource approach, where essential resources – such as the data directory – are deployed on a shared disk. A similar strategy is employed in other high-availability solutions (OVM High Availability Template for MySQL, Oracle Solaris Clustering, MySQL with Windows Cluster Failover). The flexibility of Clusterware doesn’t dictate a specific shared resource implementation – anything from a simple NFS mount to a high-performance SAN may be used. The recommended and tested solution leverages the Oracle ACFS filesystem. As with other shared-disk high availability solutions for MySQL, an Oracle Clusterware-based solution requires only one MySQL instance be using a shared MySQL data directory at any one time.
While no high availability solution for MySQL is truly transparent, the Clusterware system provides useful infrastructure to minimize downtime. The agent performs periodic health checks of the running MySQL Server using mysqladmin, and applications connect through a managed virtual IP address. The use of a managed virtual IP address directs application traffic to a failover host without requiring configuration changes at the application layer. Failover time is bounded by the interval of agent health checks (every second by default) plus the time required to start the MySQL Server on the failover host (including any necessary crash recovery processing).
A big thanks goes out to the Oracle Clusterware team who did the heavy lifting in adding MySQL support!
MySQL Connect HOL content posted
Just a quick post to note that the content from my hands-on lab at MySQL Connect (“MySQL Enterprise Features in Practice”) has been uploaded to the content catalog, and can be found here. This includes the 36-page lab manual and example commands and programs (mostly in Java; the package includes both compiled and source code). For those who attended the lab, this is an opportunity to complete the exercises we didn’t get to in the 2.5 hours, and for those who missed it, an opportunity to learn more about the features and capabilities of key MySQL Enterprise products and features such as MySQL Enterprise Audit plugin, MySQL Enterprise Monitor and MySQL Enterprise Security (PAM plugin). I hope to expand on the lab content to demonstrate other features such as MySQL Enterprise Backup, MySQL Enterprise High Availability and MySQL Enterprise Scalability, and will post updates via my blog.
Creating custom graphs in MySQL Enterprise Monitor
As a follow-up to my earlier post describing the process to create custom Advisors for MySQL Enterprise Monitor, this post will demonstrate how to create custom graphs to track metrics over time. The password policy scripts I introduced earlier will again be the basis for the data used in this post.
Collecting new data
Similar to the custom Advisor created in the earlier post, creating a custom graph starts with custom data collection. Why can’t I just use the data collections I defined in the earlier example? Because there’s a restriction on using multiple custom data types (defined as namespace+classname combinations) in a single graph, and in the earlier example, I used a different classname for each password policy definition. I want to graph all three password policy violation counts as distinct lines on the same graph, so I need change how I collect data so that I get it all back in a single data type. Here’s what I’ve added to custom.xml:
    <class>
                <namespace>password_policy</namespace>
                <classname>graph</classname>
        <precondition><![CDATA[
  SELECT COUNT(*)
    FROM information_schema.tables
    WHERE table_schema = 'password_policy'
    AND table_name = 'user_password_policy_violation'
            ]]></precondition>
                <query><![CDATA[
  SELECT SUM(IF(violation_type = 1, 1, 0)) no_password_count,
      SUM(IF(violation_type = 2, 1, 0)) expired_password_count,
      SUM(IF(violation_type = 3, 1, 0)) reused_password_count
    FROM password_policy.user_password_policy_violation
    WHERE violation_resolved = 0
                ]]></query>
                <attributes>
                        <attribute name="no_password_count" counter="false" type="INTEGER"/>
                        <attribute name="expired_password_count" counter="false" type="INTEGER"/>
                        <attribute name="reused_password_count" counter="false" type="INTEGER"/>
                </attributes>
    </class>
As before, make sure you test your SQL! It’s a real headache to get to the end of this process only to find your graph doesn’t work, and spend time tracking down the problem as bad SQL. That’s one of my wish requests for custom rules and graph creation – making it easier to diagnose problems.
Save the custom.xml file, and restart the Agent to reload the custom data collection definitions.
Define the custom graph
This also involves XML, and you can find a sample in the MEM documentation. I’ve pretty much copied that example and tweaked it. Here’s the resulting XML:
<?xml version="1.0"?>
<com_mysql_merlin_server_graph_Design>
    <version>1.0</version>
    <uuid>a77cd4f0-d3a4-4f69-a346-6f36fb6a2f56</uuid>
    <name>Password Policy Violations</name>
    <rangeLabel>Accounts</rangeLabel>
    <series>
        <label>blank passwords</label>
        <expression>blank_count</expression>
    </series>
    <series>
        <label>expired passwords</label>
        <expression>expired_count</expression>
    </series>
    <series>
        <label>reused passwords</label>
        <expression>reused_count</expression>
    </series>
    <variables>
        <name>blank_count</name>
        <dcItem>
            <nameSpace>password_policy</nameSpace>
            <className>graph</className>
            <attribName>no_password_count</attribName>
        </dcItem>
        <instance>/</instance>
    </variables>
    <variables>
        <name>expired_count</name>
        <dcItem>
            <nameSpace>password_policy</nameSpace>
            <className>graph</className>
            <attribName>expired_password_count</attribName>
        </dcItem>
        <instance>/</instance>
    </variables>
    <variables>
        <name>reused_count</name>
        <dcItem>
            <nameSpace>password_policy</nameSpace>
            <className>graph</className>
            <attribName>reused_password_count</attribName>
        </dcItem>
        <instance>/</instance>
    </variables>
</com_mysql_merlin_server_graph_Design>
Let’s break down the components. First, you need to define a UUID. I’ve previously just incremented the UUID from the example, but you can use any UUID generator you like. I used PowerShell (thanks Josh!):
D:\>powershell -Command "[guid]::NewGuid().ToString()"
a77cd4f0-d3a4-4f69-a346-6f36fb6a2f56
The <name> tag defines how this graph will be named and displayed in the dashboard. This must be unique. The <rangeLabel> should define what is displayed as the label for the Y-axis of the graph, but that seems to be affected by a bug (Oracle Bug#17556299) with custom graphs today.
For this graph, I’ve defined three different <series> – one representing each password policy. Each series has a <label> element, which defines the label for the series, and an expression. Like custom rules, you can do some transformations and computations here – the documentation has a good example, converting raw byte counts to megabytes for graphing purposes. We’re not using that here – our expressions are simply the number of violators of a given password policy. The values used – blank_count, expired_count, reused_count – are all defined in <variables> elements below. The <name> element of the <variables> tag should correspond to the value used in the <expression> tag of <series> elements above, and the <nameSpace>, <className> and <attribName> should map to the custom data collection definition, where they are found in <namespace>, <classname> and <attribute name=”…”> tags, respectively.
Upload the graph definition
Once the graph definition is complete, save it. The name doesn’t matter, as we’re going to upload it to the MEM dashboard. Finding where to upload it can be a bit tricky, though – you’ll find it by clicking the “Advisors” option under the “Configuration” menu item. Right next to the “Create Advisor” button used to create a custom rule, you’ll find the “Import / Export” button. That’s the one you want. This will take you to a page where the important elements look like below:
![]()
Use the panel on the right to import the XML file containing the custom graph definition.
Schedule the graph
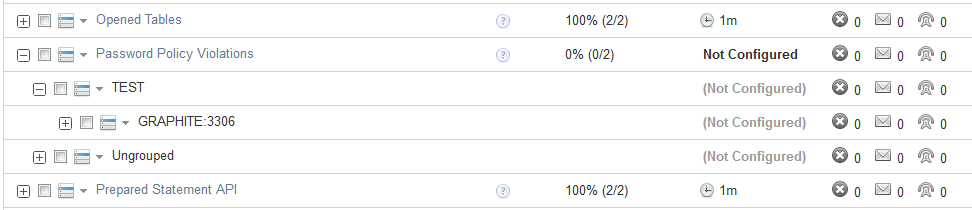
You might be tempted at this point to go directly to the graphs page and look for your graph. If you do, you won’t find it. The graph must first be scheduled. On the same “Advisors” page (under “Configuration” again), notice that the “Graphing” header shows something like, “Configured: 94 of 95”. That’s letting you know that your newly-created graph hasn’t yet been configured – expand the “Graphing” header and find the custom graph name (“Password Policy Violations”). Drill down until you find the appropriate MySQL Server instance against which to schedule the graph, click on the menu icon next to the server name, and schedule it. I chose to collect data every 1 minute; in a production environment, you may want to do this less often.
 Once the graph has been scheduled, the Service Manager will tell the Agent to start collecting the necessary data the next time it checks in. Because the graphing components need at least two data points to generate a graph, you’ll want to wait a couple of minutes before looking for results in the graphs.
Finding the custom graph
After waiting the requisite couple of minutes, navigate to the “All Timeseries Graphs” item under the “Reports & Graphs” menu item. Select the appropriate host from the asset selector on the left-hand side, and expand the filter options by clicking the magnifying glass icon towards the top-right of the page. Here, you can select the “Password Policy Violations” graph, push the “Filter” button, and be rewarded with a view of your custom graph:
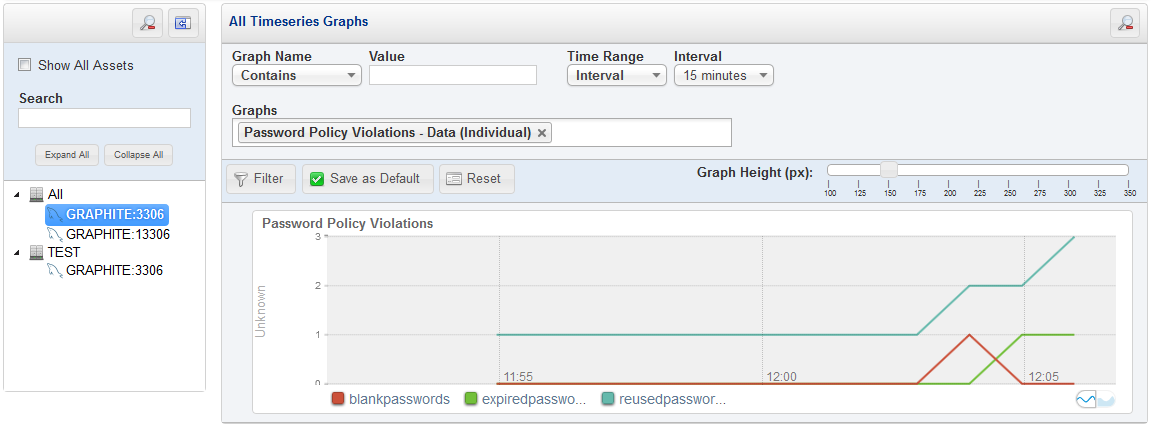 Note that I manipulated the password_policy.user_password_policy_violation table to show something more interesting than flat lines.
Conclusion
Custom graphs can give you visibility into trends over time for certain characteristics. While the example presented here uses custom data elements, you can create your own custom graphs using either standard data elements MEM already collects or extend MEM’s data collection to expose metrics useful for monitoring your applications or deployments.
Creating custom rules in MySQL Enterprise Monitor
Quite some time ago, I published scripts to implement password policies for MySQL, and promised to show how to expose violations of that policy via MySQL Enterprise Monitor (MEM). That stalled somewhat with other objectives, but I want to revisit it now that MEM 3.0 is GA. If you haven’t tried MEM 3.0 yet, consider doing so – it’s quick and easy to set up.
Many people don’t realize that MEM can be extended to monitor things beyond MySQL Server health, including visibility into application state as observed from the database. In part of the hands-on-lab I recently led at MySQL Connect, we implemented simple application state monitoring to alert – via MEM – when the number of active application sessions exceeded certain thresholds. This isn’t a new feature in MEM 3.0 – it was possible in earlier versions as well, and the process I’ll describe here in adding MEM alerting to password policy violations can be applied with only a few modifications to MEM 2.3 deployments.
Continue reading Creating custom rules in MySQL Enterprise Monitor
Understanding max_connect_errors
To only slightly misquote one of the greatest movies of all times:
You keep using that option. I do not think it means what you think it means.
Perhaps like many users, I had certain assumptions about what max_connect_errors really does – but in looking closely as part of investigating the new PERFORMANCE_SCHEMA.HOST_CACHE table in MySQL 5.6, I learned that some very fundamental elements had escaped my notice. I’m writing this blog post to help others who hold similar misconceptions of what this option does.
Practical P_S: From which hosts are connections being attempted?
MySQL Server has an aborted_connect status counter which will show you the number of failed attempts to establish a new connection. The manual describes potential causes as follows:
- A client does not have privileges to connect to a database.
- A client uses an incorrect password.
- A connection packet does not contain the right information.
- It takes more than
connect_timeoutseconds to get a connect packet. See Section 5.1.4, “Server System Variables”.
It goes on to make the following statement:
If these kinds of things happen, it might indicate that someone is trying to break into your server! Messages for these types of problems are logged to the general query log if it is enabled. Continue reading Practical P_S: From which hosts are connections being attempted?