Many MySQL users are familiar with using slow query logs and tools such as mysqldumpslow to identify poor-performing SQL commands, and MySQL 5.6 introduces new powerful tools in PERFORMANCE_SCHEMA. Both allow you to identify the date/time and the user account from which the command was issued, which is helpful – but if you’re using MySQL Enterprise Monitor (MEM), you can immediately identify the actual line of code responsible for the SQL command in question. This happens to be one of my favorite and powerful features of MEM, but it’s frequently overlooked by new and experienced MEM users alike, so I’m writing the post to highlight it.
MySQL Enterprise Monitor, of course, is a commercial product that’s part of the MySQL Enterprise subscription. But it’s freely-available under 30-day trial terms for evaluation from Oracle Software Delivery Cloud – if you aren’t a commercial customer, consider downloading MEM to see what it can do for you. And if you are a MySQL Enterprise subscriber who hasn’t deployed MEM, or haven’t yet explored some of the more advanced features, now’s the time to do so.
MEM includes functionality called Query Analyzer (or QUAN for short). When this feature was initially introduced in version 2.0, it was entirely dependent upon MySQL Proxy to intercept SQL commands between the client and the server, where useful metrics such as execution time and result set size and shipping that information to MEM along with other useful information like the query EXPLAIN plan. This was useful, but there were some limitations. Proxy doesn’t (yet) scale very well, is a single point of failure, requires deployment reconfiguration (either of the application or the MySQL server so that it listens on the ports to which applications are talking), and masks client host information from the server (for authentication in particular).
Subsequent improvements to this QUAN functionality improved the situation by enabling data collection directly within several connectors which support it – if you are using Java, .NET or PHP languages, you can use connector plugins that collect data for QUAN and ship it to MEM without deploying Proxy. You also get additional insight into your application, as the connector plugins can identify the source from which queries originate. Here’s a sample screenshot, showing the stack trace collected for the example query in QUAN data:
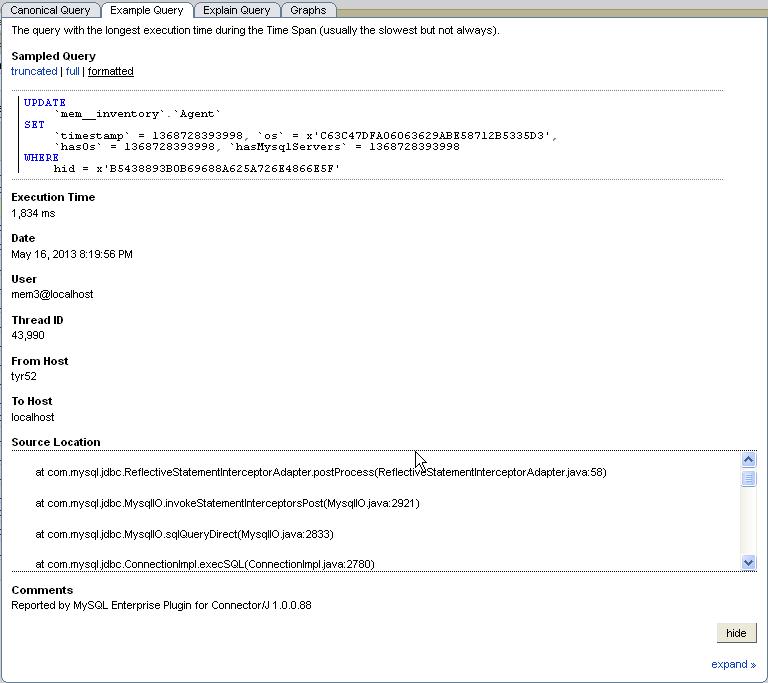
In a “DevOps” world, this is a killer feature, giving developers immediate insight into database-level performance problems which maps directly to specific lines of code in the application which trigger the problems. The MEM development team uses this feature to troubleshoot MEM performance itself – Mark Matthews explains this in a great post here (note that the stack trace QUAN data was still being fleshed out). When coupled with other MEM features such as advanced QUAN data filtering and graph-based filtering, users can quickly isolate the specific events which cause concern.
If you’re a developer for a MySQL-backed application who also has to cover DBA responsibilities, or if you’re a MySQL DBA looking to provide more directive feedback to the developers you work with, this feature of MEM is worth checking out.
