Just a quick post to note that the content from my hands-on lab at MySQL Connect (“MySQL Enterprise Features in Practice”) has been uploaded to the content catalog, and can be found here. This includes the 36-page lab manual and example commands and programs (mostly in Java; the package includes both compiled and source code). For those who attended the lab, this is an opportunity to complete the exercises we didn’t get to in the 2.5 hours, and for those who missed it, an opportunity to learn more about the features and capabilities of key MySQL Enterprise products and features such as MySQL Enterprise Audit plugin, MySQL Enterprise Monitor and MySQL Enterprise Security (PAM plugin). I hope to expand on the lab content to demonstrate other features such as MySQL Enterprise Backup, MySQL Enterprise High Availability and MySQL Enterprise Scalability, and will post updates via my blog.
Why you should register for MySQL 5.6 certification exams now
I’ve previously shared my excitement over the coming Oracle Certified Professional exams for MySQL 5.6 (both Developer and DBA), and I’m putting my (employer’s) money where my mouth is – I’ve registered to sit for the DBA exam in early November (some test sites have limited opportunities; interested candidates should consider booking now). Here’s why I think others should do the same:
Low cost
During the beta period (through December 14), the cost of the exam is only $50 USD. That’s barely more than the cost of a book or study guide these days, and a significant savings from the normal exam prices.
Full certification
Those who pass the exam will be given a full certification – not some lesser “beta certification.” There’s no distinction between those who pass the exam during the beta period and those who pass later.
Help produce better exams
Beta test takers contribute to better exams – the results are analyzed to find the best (and worst) questions to indicate success. Those questions which don’t correlate to overall success on the exam are left off the production exams.
This last point raises the only real drawbacks in taking a beta exam. Because questions are being screened as well as candidates, exams consist of 150 questions instead of 70, making the time commitment larger (3h). Since certain questions will be discarded based on low correlation to overall success, it also means candidates must wait until the end of the beta period before results can be provided. If you can deal with a longer test and subsequent wait for results, this beta exam is a great, low-risk way to get your MySQL 5.6 certification – all while helping ensure the final certification exams contain the most relevant questions.
Consider registering today!
Creating custom graphs in MySQL Enterprise Monitor
As a follow-up to my earlier post describing the process to create custom Advisors for MySQL Enterprise Monitor, this post will demonstrate how to create custom graphs to track metrics over time. The password policy scripts I introduced earlier will again be the basis for the data used in this post.
Collecting new data
Similar to the custom Advisor created in the earlier post, creating a custom graph starts with custom data collection. Why can’t I just use the data collections I defined in the earlier example? Because there’s a restriction on using multiple custom data types (defined as namespace+classname combinations) in a single graph, and in the earlier example, I used a different classname for each password policy definition. I want to graph all three password policy violation counts as distinct lines on the same graph, so I need change how I collect data so that I get it all back in a single data type. Here’s what I’ve added to custom.xml:
    <class>
                <namespace>password_policy</namespace>
                <classname>graph</classname>
        <precondition><![CDATA[
  SELECT COUNT(*)
    FROM information_schema.tables
    WHERE table_schema = 'password_policy'
    AND table_name = 'user_password_policy_violation'
            ]]></precondition>
                <query><![CDATA[
  SELECT SUM(IF(violation_type = 1, 1, 0)) no_password_count,
      SUM(IF(violation_type = 2, 1, 0)) expired_password_count,
      SUM(IF(violation_type = 3, 1, 0)) reused_password_count
    FROM password_policy.user_password_policy_violation
    WHERE violation_resolved = 0
                ]]></query>
                <attributes>
                        <attribute name="no_password_count" counter="false" type="INTEGER"/>
                        <attribute name="expired_password_count" counter="false" type="INTEGER"/>
                        <attribute name="reused_password_count" counter="false" type="INTEGER"/>
                </attributes>
    </class>
As before, make sure you test your SQL! It’s a real headache to get to the end of this process only to find your graph doesn’t work, and spend time tracking down the problem as bad SQL. That’s one of my wish requests for custom rules and graph creation – making it easier to diagnose problems.
Save the custom.xml file, and restart the Agent to reload the custom data collection definitions.
Define the custom graph
This also involves XML, and you can find a sample in the MEM documentation. I’ve pretty much copied that example and tweaked it. Here’s the resulting XML:
<?xml version="1.0"?>
<com_mysql_merlin_server_graph_Design>
    <version>1.0</version>
    <uuid>a77cd4f0-d3a4-4f69-a346-6f36fb6a2f56</uuid>
    <name>Password Policy Violations</name>
    <rangeLabel>Accounts</rangeLabel>
    <series>
        <label>blank passwords</label>
        <expression>blank_count</expression>
    </series>
    <series>
        <label>expired passwords</label>
        <expression>expired_count</expression>
    </series>
    <series>
        <label>reused passwords</label>
        <expression>reused_count</expression>
    </series>
    <variables>
        <name>blank_count</name>
        <dcItem>
            <nameSpace>password_policy</nameSpace>
            <className>graph</className>
            <attribName>no_password_count</attribName>
        </dcItem>
        <instance>/</instance>
    </variables>
    <variables>
        <name>expired_count</name>
        <dcItem>
            <nameSpace>password_policy</nameSpace>
            <className>graph</className>
            <attribName>expired_password_count</attribName>
        </dcItem>
        <instance>/</instance>
    </variables>
    <variables>
        <name>reused_count</name>
        <dcItem>
            <nameSpace>password_policy</nameSpace>
            <className>graph</className>
            <attribName>reused_password_count</attribName>
        </dcItem>
        <instance>/</instance>
    </variables>
</com_mysql_merlin_server_graph_Design>
Let’s break down the components. First, you need to define a UUID. I’ve previously just incremented the UUID from the example, but you can use any UUID generator you like. I used PowerShell (thanks Josh!):
D:\>powershell -Command "[guid]::NewGuid().ToString()"
a77cd4f0-d3a4-4f69-a346-6f36fb6a2f56
The <name> tag defines how this graph will be named and displayed in the dashboard. This must be unique. The <rangeLabel> should define what is displayed as the label for the Y-axis of the graph, but that seems to be affected by a bug (Oracle Bug#17556299) with custom graphs today.
For this graph, I’ve defined three different <series> – one representing each password policy. Each series has a <label> element, which defines the label for the series, and an expression. Like custom rules, you can do some transformations and computations here – the documentation has a good example, converting raw byte counts to megabytes for graphing purposes. We’re not using that here – our expressions are simply the number of violators of a given password policy. The values used – blank_count, expired_count, reused_count – are all defined in <variables> elements below. The <name> element of the <variables> tag should correspond to the value used in the <expression> tag of <series> elements above, and the <nameSpace>, <className> and <attribName> should map to the custom data collection definition, where they are found in <namespace>, <classname> and <attribute name=”…”> tags, respectively.
Upload the graph definition
Once the graph definition is complete, save it. The name doesn’t matter, as we’re going to upload it to the MEM dashboard. Finding where to upload it can be a bit tricky, though – you’ll find it by clicking the “Advisors” option under the “Configuration” menu item. Right next to the “Create Advisor” button used to create a custom rule, you’ll find the “Import / Export” button. That’s the one you want. This will take you to a page where the important elements look like below:
![]()
Use the panel on the right to import the XML file containing the custom graph definition.
Schedule the graph
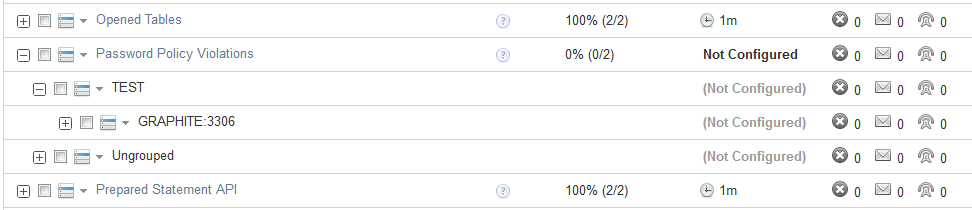
You might be tempted at this point to go directly to the graphs page and look for your graph. If you do, you won’t find it. The graph must first be scheduled. On the same “Advisors” page (under “Configuration” again), notice that the “Graphing” header shows something like, “Configured: 94 of 95”. That’s letting you know that your newly-created graph hasn’t yet been configured – expand the “Graphing” header and find the custom graph name (“Password Policy Violations”). Drill down until you find the appropriate MySQL Server instance against which to schedule the graph, click on the menu icon next to the server name, and schedule it. I chose to collect data every 1 minute; in a production environment, you may want to do this less often.
 Once the graph has been scheduled, the Service Manager will tell the Agent to start collecting the necessary data the next time it checks in. Because the graphing components need at least two data points to generate a graph, you’ll want to wait a couple of minutes before looking for results in the graphs.
Finding the custom graph
After waiting the requisite couple of minutes, navigate to the “All Timeseries Graphs” item under the “Reports & Graphs” menu item. Select the appropriate host from the asset selector on the left-hand side, and expand the filter options by clicking the magnifying glass icon towards the top-right of the page. Here, you can select the “Password Policy Violations” graph, push the “Filter” button, and be rewarded with a view of your custom graph:
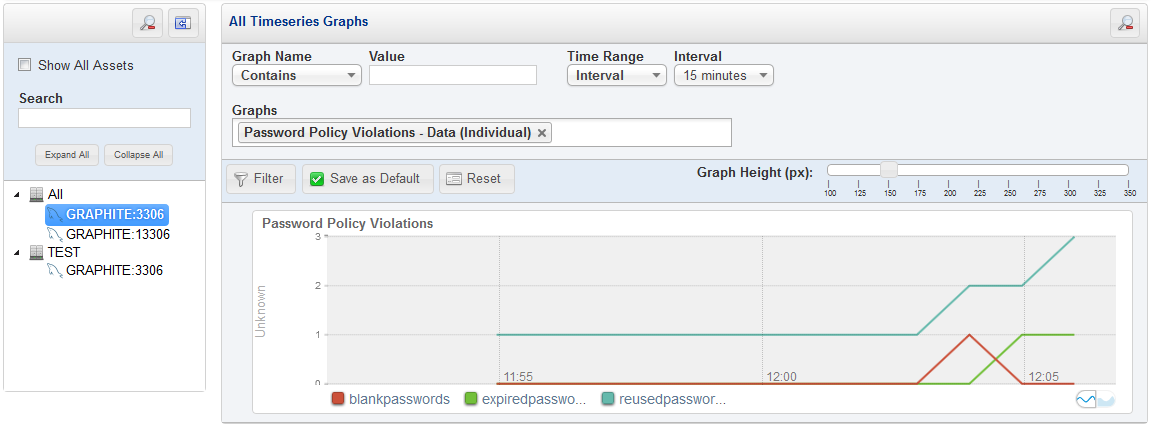 Note that I manipulated the password_policy.user_password_policy_violation table to show something more interesting than flat lines.
Conclusion
Custom graphs can give you visibility into trends over time for certain characteristics. While the example presented here uses custom data elements, you can create your own custom graphs using either standard data elements MEM already collects or extend MEM’s data collection to expose metrics useful for monitoring your applications or deployments.
Installing MySQL Fabric on Windows
One of the major announcements made at the MySQL Connect conference just over a week ago was the labs release of MySQL Fabric, which supports management of MySQL Server farms in a sharded deployment. It’s available on labs.mysql.com, which means it is just an early release with some rough edges. One of those rough edges that I’d like to see resolved soon is that it’s difficult to install on Windows, as there is no installer package provided. There is some documentation on how to install Fabric (you’ll find it in section 15.8.2 of the PDF that makes up the downloadable documentation), but it’s focused on Linux platforms, so I thought I would post the process that got Fabric installed on my Windows 7 machine, for other Windows users who want to play with Fabric. Here are the steps:
Creating custom rules in MySQL Enterprise Monitor
Quite some time ago, I published scripts to implement password policies for MySQL, and promised to show how to expose violations of that policy via MySQL Enterprise Monitor (MEM). That stalled somewhat with other objectives, but I want to revisit it now that MEM 3.0 is GA. If you haven’t tried MEM 3.0 yet, consider doing so – it’s quick and easy to set up.
Many people don’t realize that MEM can be extended to monitor things beyond MySQL Server health, including visibility into application state as observed from the database. In part of the hands-on-lab I recently led at MySQL Connect, we implemented simple application state monitoring to alert – via MEM – when the number of active application sessions exceeded certain thresholds. This isn’t a new feature in MEM 3.0 – it was possible in earlier versions as well, and the process I’ll describe here in adding MEM alerting to password policy violations can be applied with only a few modifications to MEM 2.3 deployments.
Continue reading Creating custom rules in MySQL Enterprise Monitor
New MySQL 5.6 Developer Certification Exam
You may have already seen the news: Oracle is launching an updated certification for MySQL Developers, based on MySQL Server 5.6. This is exciting to me for several reasons that I want to share:
Only one exam
Earlier versions of the MySQL Developer certification required sitting for two separate exams. One goal in redefining the certification process was to make it more accessible to candidates, and reducing the cost – in both time and money – developers need to invest in examinations. This obviously presented a challenge to cover the same material – actually more, when you consider MySQL 5.6 features – in fewer questions, but we feel we’ve done it.
Content from the experts
Content creation for this exam has drawn from many different volunteers from a wide range of MySQL teams including Training, Engineering and Sales Consultants – but it drew most heavily from the amazing MySQL Support Team, who assist developers (and DBAs) daily with MySQL questions, and who understand better than just about anybody what these developers need to know in order to successfully develop applications against MySQL Server 5.6. The covered exam topics are listed here.
Better question format
As we wrote new exam questions and reviewed those from the earlier version of the MySQL Developer certification exams, we ensured that the questions were written in such a way to test the candidate’s knowledge, rather than ability to decipher the question. In particular, that means no more open-ended multiple-guess questions, where it’s unclear whether one … or two … or three … or four of the six possible answers are correct. As somebody who has taken his fair share of MySQL certification exams in the past, this was a pet peeve of mine with earlier exams.
Development focus
Because this is a developer-focused certification, we want successful candidates to be able to demonstrate ability to write MySQL-backed applications in several common languages. One does not need to be an expert at all languages to pass the exam, but understanding common language-specific idioms and best practices are important. That’s a step beyond the earlier certification, which focused almost exclusively on SQL statements. There’s more to writing good MySQL-backed applications than writing sound SQL, and this exam expands scope to include more of that necessary knowledge.
Alignment with MySQL Developer Training
Naturally, the certification process covers the same ground as Oracle’s MySQL Training for Developers course, making that an ideal opportunity to get up to speed on the topics which will help you pass the exam, but more importantly, develop successful applications that use MySQL Server 5.6 as a data store.
A huge thanks to the MySQL Support Team and Training Team at Oracle for helping drive this update, as well as those from other MySQL teams here at Oracle who contributed time and content.
Implementing a host blacklist with MySQL privileges
When I saw Shlomi’s recent post which asked (in part) for blacklist support in MySQL, I started thinking about ways in which this could be done using the tools we have today. Here’s the example requirements Shlomi noted:
Speaking of whitelist, it would be great to have a host blacklist. If I wanted to grant access to ‘gromit’@’192.168.%’ except for ‘192.168.10.%’ — well, I would have to whitelist all the possible subnets. I can’t exclude a set of hosts.
I think that’s entirely possible without the overhead of whitelisting all possible subnets – let’s give it a go!
Continue reading Implementing a host blacklist with MySQL privileges
Speaking at MySQL Connect
 The MySQL Connect content catalog is published, and I’ll be leading a hands-on lab on MySQL Enterprise Features in Practice [HOL9787]. If you have wondered how to get the most out of the features of MySQL Enterprise subscriptions – whether you are an existing Enterprise customer or not – this lab is for you. We’ll help you understand the benefits of the various components of the MySQL Enterprise subscription as you install, configure, demonstrate and use the features. You’ll learn how best practices and helpful tips, and work through sample customization exercises illustrating how tools such as MySQL Enterprise Monitor, MySQL Enterprise Backup and Security, Audit and Scalability components of MySQL Server can be applied to your MySQL use cases. I’ll be joined by Engineering staff responsible for several of these key products/features, so it’s a great opportunity to learn more about features that can make your life easier directly from the experts!
It’s also very likely I will be found at the Application Development with MySQL, Java, PHP, and Python [BOF4743] if you want to talk Java with me.
Understanding max_connect_errors
To only slightly misquote one of the greatest movies of all times:
You keep using that option. I do not think it means what you think it means.
Perhaps like many users, I had certain assumptions about what max_connect_errors really does – but in looking closely as part of investigating the new PERFORMANCE_SCHEMA.HOST_CACHE table in MySQL 5.6, I learned that some very fundamental elements had escaped my notice. I’m writing this blog post to help others who hold similar misconceptions of what this option does.
MySQL 5.6 users – prevent host blocked errors
The much-improved PERFORMANCE_SCHEMA in MySQL 5.6 provides visibility into MySQL’s host cache, including the ability to monitor for impending blocked hosts. You can do this with the following query:
mysql> SELECT
    ->  ip,
    ->  host,
    ->  host_validated,
    ->  sum_connect_errors
    -> FROM performance_schema.host_cache\G
*************************** 1. row ***************************
                ip: 192.168.2.4
              host: TFARMER-MYSQL.wh.oracle.com
    host_validated: YES
sum_connect_errors: 3
1 row in set (0.02 sec)
That’s helpful information, and allows DBAs to identify problematic hosts before they are blocked. Due to Bug#69807, it’s also something MySQL 5.6 users will want to do. This bug causes the counter maintained in the host cache for failed connections – against which max_connect_errors is compared – to never be reset by a valid connection. The end result is that over time, hosts may reach the max_connect_errors threshold and be blocked.
Continue reading MySQL 5.6 users – prevent host blocked errors